About VirMolAnalyte V2.0
Project information
VirMolAnalyte V2.0 is developed by the research team at the Kunming Institute of Botany, Chinese Academy of Sciences.
The project is released under the MIT License, supporting open use, modification, and redistribution under the terms of that license.
Related publication
VirMolAnalyte V1.0 was introduced in the following publication:
Guilin Hu, Jameel Hizam Alafifi, and Minghua Qiu.
VirMolAnalyte: An AI-Driven In Silico Metabolite Annotation Tool.
Analytical Chemistry 2025, 97, 28181-28191.
Design rationale
The VirMolAnalyte tool series was developed to meet a specific challenge in natural product (NP) research: how to move structure annotation forward when workflows rely almost entirely on matching experimental spectra to in silico virtual molecular databases. Large simulated libraries (e.g. MMDB-scale resources) make high-throughput screening feasible, but structure-level Top-N lists alone often provide limited transparency—particularly for novel or weakly represented metabolites—regarding why a candidate ranks highly, which substructures are supported by the data, and how confident one should be before investing in full multidimensional NMR or total synthesis.
VirMolAnalyte addresses this limitation by pairing scalable virtual-library search with mechanisms that strengthen both accuracy and interpretability:
- Accuracy — multi-dimensional filters (CNF, CTNF, MW), learned NMR2FP-DNN fingerprints combined with structure-derived descriptors, and (in V2.0) per-carbon attribution and fragment-level evidence beyond whole-molecule similarity alone.
- Interpretability — explicit structure–spectrum and substructure–peak linkage, fragment-highlighted views, fusion of cross-candidate evidence, and optional context-grounded AI narration of screening results.
Across V1.0 and V2.0, the overarching goal is to offer an efficient, low-barrier route to preliminary NP structure hypothesis generation from routine ¹³C / DEPT data—supporting dereplication and early annotation decisions without replacing full structure elucidation, but reducing dependence on costly, time-intensive workflows at the first analytical stage.
What is VirMolAnalyte V2.0?
VirMolAnalyte V2.0 is a toolchain for natural product (NP) structure identification from one-dimensional NMR data. The PyQt5 GUI (virmol_gui.py) integrates:
| Capability | Description |
|---|---|
| Spectral preprocessing | Read Bruker pdata (¹³C, DEPT90, DEPT135), peak picking, merge, solvent/impurity removal |
| Database screening | Search pre-built or custom NP libraries (.npz) with carbon-number / carbon-type / MW filters |
| Scoring | Rank candidates with CSS, AAS, FPS, or FPAACS |
| Fragment attribution | Random masking AAS (Monte Carlo or CSS threshold baseline), positive-fragment extraction, intra- and cross-candidate fusion |
| AI assistant | Rule-based diagnosis and optional LLM interpretation (Top-N hits, fragment narratives, Methods polish) |
What does V2.0 add beyond V1.0?
The figure below summarizes how the V1.0 web tool and the V2.0 desktop application fit together: panel (a) is the established V1.0 screening workflow; panels (b) and (c) are new in V2.0.
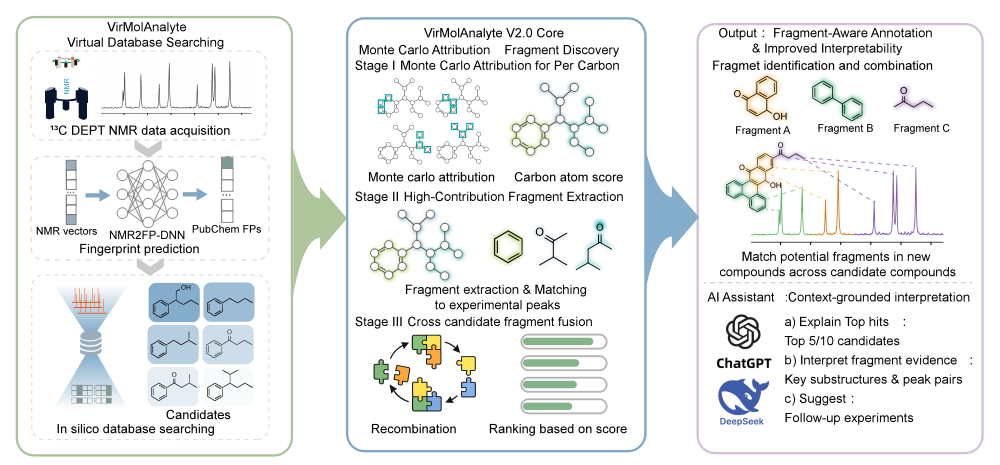
Figure 1 · V1.0 screening and V2.0 extensions
End-to-end workflow for ¹³C DEPT–based annotation. (a) corresponds to VirMolAnalyte V1.0 (browser). (b) and (c) are V2.0-only capabilities in the desktop GUI.
(a) V1.0 — Virtual-library screening
V1.0 · Web
Match experimental ¹³C DEPT peak lists to in silico databases (e.g. AllDB, PlantDB, HMDB) on virmolanalyte.top. NMR2FP-DNN predicts NMR fingerprints; these are combined with structure-derived fingerprints to return Top-N candidates for structure-level ranking with CSS, AAS, FPS, or FPAACS, plus CNF / CTNF / MW filters.
Still the recommended option if you only need database search—no fragment or AI modules required.
(b) V2.0 — Fragment-level attribution
V2.0 · Desktop
New: Monte Carlo random masking AAS estimates per-carbon attribution scores. High-confidence carbons define fragment cores that are matched to experimental peaks; evidence from multiple Top-N structures is pooled, cross-candidate fused, and re-ranked by attribution strength and spectral coverage—moving from whole-molecule hits to substructure-level evidence.
(c) V2.0 — Interpretable outputs & AI Assistant
V2.0 · Desktop
New: Fragment-aware reporting—structure–spectrum linkage, fragment-highlighted structures, and ranked fragment combinations—in the GUI. The AI Assistant adds rule-based screening diagnosis and optional LLM interpretation grounded in candidate and fragment context (e.g. Top hits, fusion maps, Methods text).
In short
V1.0 (a) delivers fast, browser-based database screening. V2.0 (b–c) keeps that screening core in the desktop app and adds fragment attribution, richer visualization, and AI-assisted interpretation for novel or ambiguous structures where structure-level Top-N lists alone are not enough.
Full figure caption (publication style)
Figure 1 | Overview of the VirMolAnalyte V2.0 framework for fragment-aware structure annotation from ¹³C DEPT NMR spectra. (a) VirMolAnalyte V1.0: experimental ¹³C DEPT NMR spectra (peak lists) are matched against virtual molecular databases via the web application; NMR2FP-DNN and structure-derived fingerprints retrieve Top-N candidate structures with CSS, AAS, FPS, or FPAACS scoring. (b) V2.0 extension: a Monte Carlo attribution-driven fragment discovery module applies random masking and sampling, extracts fragment cores matched to experimental peaks, and performs cross-candidate fusion with attribution- and coverage-based ranking. (c) V2.0 extension: the desktop framework outputs fragment-aware annotations (structure–spectrum linkage, fragment-highlighted representations, ranked fragment combinations) and supports context-grounded LLM-assisted interpretation. Together, (b) and (c) improve interpretability beyond conventional V1.0 database matching, especially for novel compounds.
Who is this guide for?
Researchers who:
- Have Bruker 1D NMR processed data (
pdata) or a ready peak list (ppm + DEPT type) - Want to screen large NP databases and inspect Top hits with structures and spectra
- Need per-carbon attribution and substructure–spectrum mapping for publication or validation