Quick Start
Start with VirMolAnalyte V2.0
Choose the fastest path from Bruker spectra, a prepared peak list, or the AI Assistant into database screening and fragment evidence.
This page follows the current GUI layout and button names. The main tabs are: AI Assistant, Molecular Analysis, Fragment Analysis, Database Management, and Other Tool.
For most users, start from Molecular Analysis. Use AI Assistant when you want a guided workflow or LLM-assisted interpretation.
Video tutorials
1. Database search from raw data
Use Molecular Analysis with Bruker 1D NMR folders, run Submit / Merge, load a database, then click Start Analysis.
2. Database searching from peak list
Paste a peak list into Manual peak input, load a database, and run screening without spectral preprocessing.
3. Database searching from AI Agent
Use AI Assistant to run a guided screening workflow from pasted or loaded peak data.
4. Fragment Analysis
After screening, switch to Fragment Analysis, run Run masking attribution, then Extract positive fragments + map.
Legacy quick demo
This older short demo shows bundled Bruker data, default peak-picking thresholds, Plant database, CNF/CTNF filters, and FPAACS ranking.Choose a workflow
| Your starting point | GUI tab | Recommended path |
|---|---|---|
Bruker pdata/1 folders |
Molecular Analysis | Path A |
Existing ppm, type peak list |
Molecular Analysis | Path B |
| Want guided automation | AI Assistant | Path C |
| Want fragment evidence after screening | Fragment Analysis | Path D |
| Only need to draw/export a structure | Other Tool | Path E |
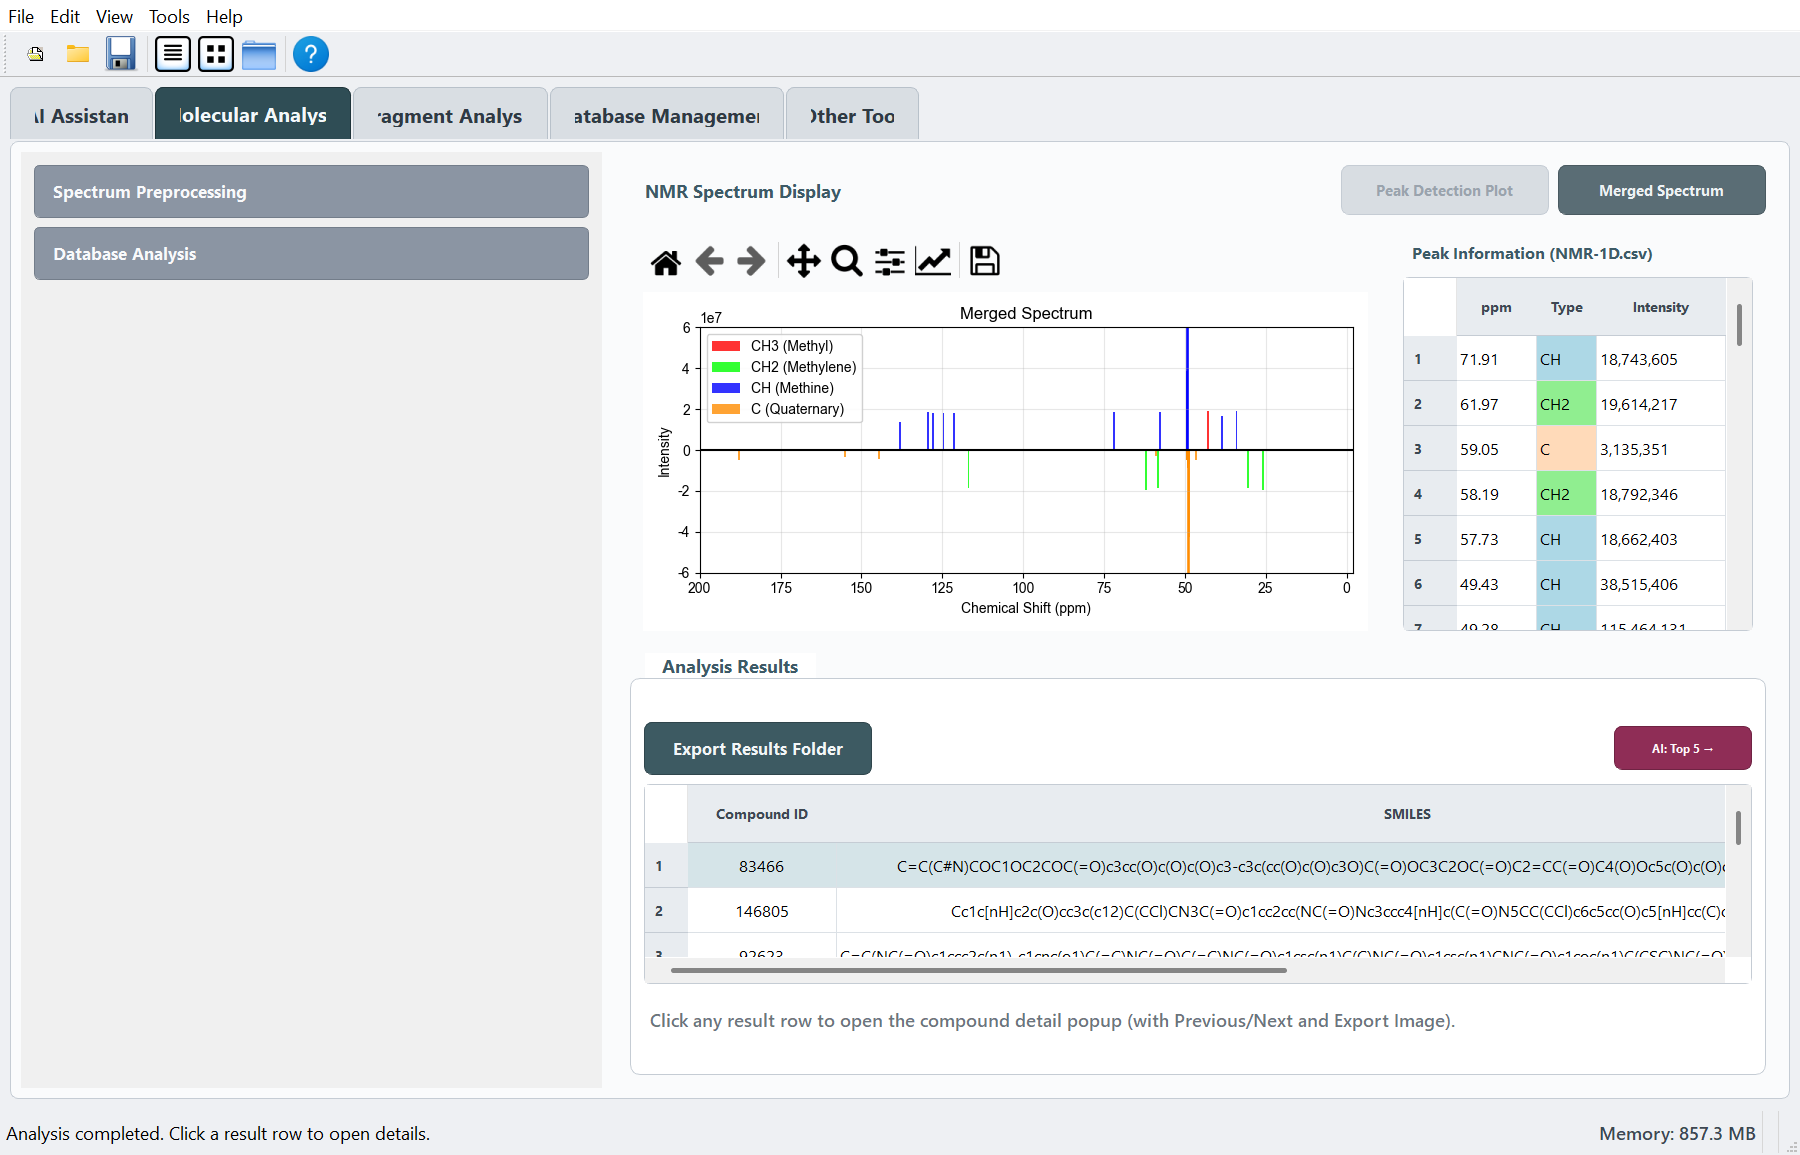
Path A: Raw Bruker 1D data -> Top hits
- Open Molecular Analysis.
- In Spectrum Preprocessing, set the three folders:
13C_NMR,DEPT90, andDEPT135. Each should usually point to a Bruker.../pdata/1directory. - Check Peak Detection Parameters. The demo values are already filled for the bundled example data.
- Click Submit to detect peaks.
- Click Merge to create the combined peak table. This writes
GUI_result_files/NMR-1D.csv. - Optional: use Solvent Removal or Impurity Removal, then click the corresponding Submit button.
- In Database Analysis, choose a database and click Load Database. For a custom
.npz, use Load Other Database. - Confirm filters and evaluator. Default screening uses CNF, CTNF, and FPAACS.
- Click Start Analysis.
- Review Analysis Results. Click a row to open Compound Details.
- Use Export Results Folder to save
Result.csv,NMR-1D.csv, a Top-20 structure grid, and analysis parameters. - Optional: click Copy methods text or AI: Top 5 ->.
Path B: Peak list only -> Top hits
- Open Molecular Analysis.
- In Database Analysis, paste peaks into Manual peak input.
- Use one peak per line:
131.2, s
116.3, d
36.8, t
27.1, q
- Accepted type labels are
q,t,d,s;CH3,CH2,CH, andCare also accepted. - Choose a database and click Load Database.
- Confirm filters and evaluator.
- Click Start Analysis.
- Review Analysis Results and open Compound Details if needed.
Path C: AI Assistant guided screening
- Open AI Assistant.
- Use Open file..., Use NMR-1D.csv, Example case, or paste peaks directly into the chat input.
- Check the workflow/default settings shown in the AI panel.
- Run the guided screening action from the AI Assistant.
- When the workflow finishes, results appear in Molecular Analysis and downstream fragment tools become available.
- For cloud LLM interpretation, open Preferences first and configure an API key.
Path D: Fragment Analysis after screening
- Finish Start Analysis in Molecular Analysis first. At least one hit is required.
- Open Fragment Analysis.
- Set Top N candidates to analyze and masking parameters if needed.
- Click Run masking attribution.
- Select a completed candidate from the candidate selector.
- Click Extract positive fragments + map.
- Optional: run intra-molecular fusion or Run fusion analysis (Top combinations).
- Use Save HD (SVG/PNG) for publication-quality structure exports.
- Optional: use the AI buttons for signal assignment or fragment evidence review.
Path E: Draw a structure only
- Open Other Tool.
- Paste a SMILES string.
- Click Draw Structure.
- Optional: enable atom index, rotate, or flip the structure.
- Click Save HD (SVG/PNG).
Before clicking Start Analysis
- Database has been loaded. The button changes to a loaded state.
- Peaks are available from
GUI_result_files/NMR-1D.csvor Manual peak input. - At least one evaluator is selected. Default: FPAACS.
- CNF / CTNF / MW filters match the sample and database scope.
Before Fragment Analysis
- Start Analysis has finished successfully.
- Analysis Results contains at least one candidate.
- Experimental peaks are still available from manual input or
GUI_result_files/NMR-1D.csv. - For AI review, configure Preferences if cloud LLM output is needed.
Output files
Default output folder:
GUI_result_files/
Common files:
| File | Created by |
|---|---|
NMR-1D.csv |
Merge, solvent removal, impurity removal, or export |
Result.csv |
Start Analysis or Export Results Folder |
analysis_parameters.txt |
Export Results Folder |
Top20_structures_5x4.png |
Export Results Folder |
ai_log.jsonl |
AI Assistant actions |
Next steps
| Goal | Read |
|---|---|
| Every control on Molecular Analysis | Molecular Analysis |
| Masking modes and fragment fusion | Fragment Analysis |
| LLM/API setup | AI Assistant |
Custom .npz library |
Database Management |
| Standalone structure drawing | Other Tool |