Molecular Analysis
Overview
The Molecular Analysis tab is the primary entry point for ¹³C / DEPT spectral processing and natural product database screening. Main capabilities:
- Spectral input and peak picking: Load Bruker
pdatafor ¹³C, DEPT90, and DEPT135; detect peaks with adjustable intensity thresholds; merge peaks into a unified peak table (NMR-1D.csv). - Signal cleanup: Remove solvent and impurity signals by carbon type (CH₃, CH₂, CH, C).
- Manual or file-based peaks: Optionally skip preprocessing by pasting
ppm, q/t/d/slines. - Database search: Load built-in or custom
.npzlibraries; apply CNF / CTNF / MW filters; rank hits with CSS, AAS, FPS, or FPAACS (default Top 80). - Results inspection: Table of candidates; Compound Details popup with structure, predicted vs experimental spectrum, export, and AI interpret.
- Methods export: Copy methods text builds an English Methods paragraph from current GUI parameters (including Fragment settings).
Interface Layout
The tab uses a left control panel (max width ~650 px, scrollable) and a right results panel:
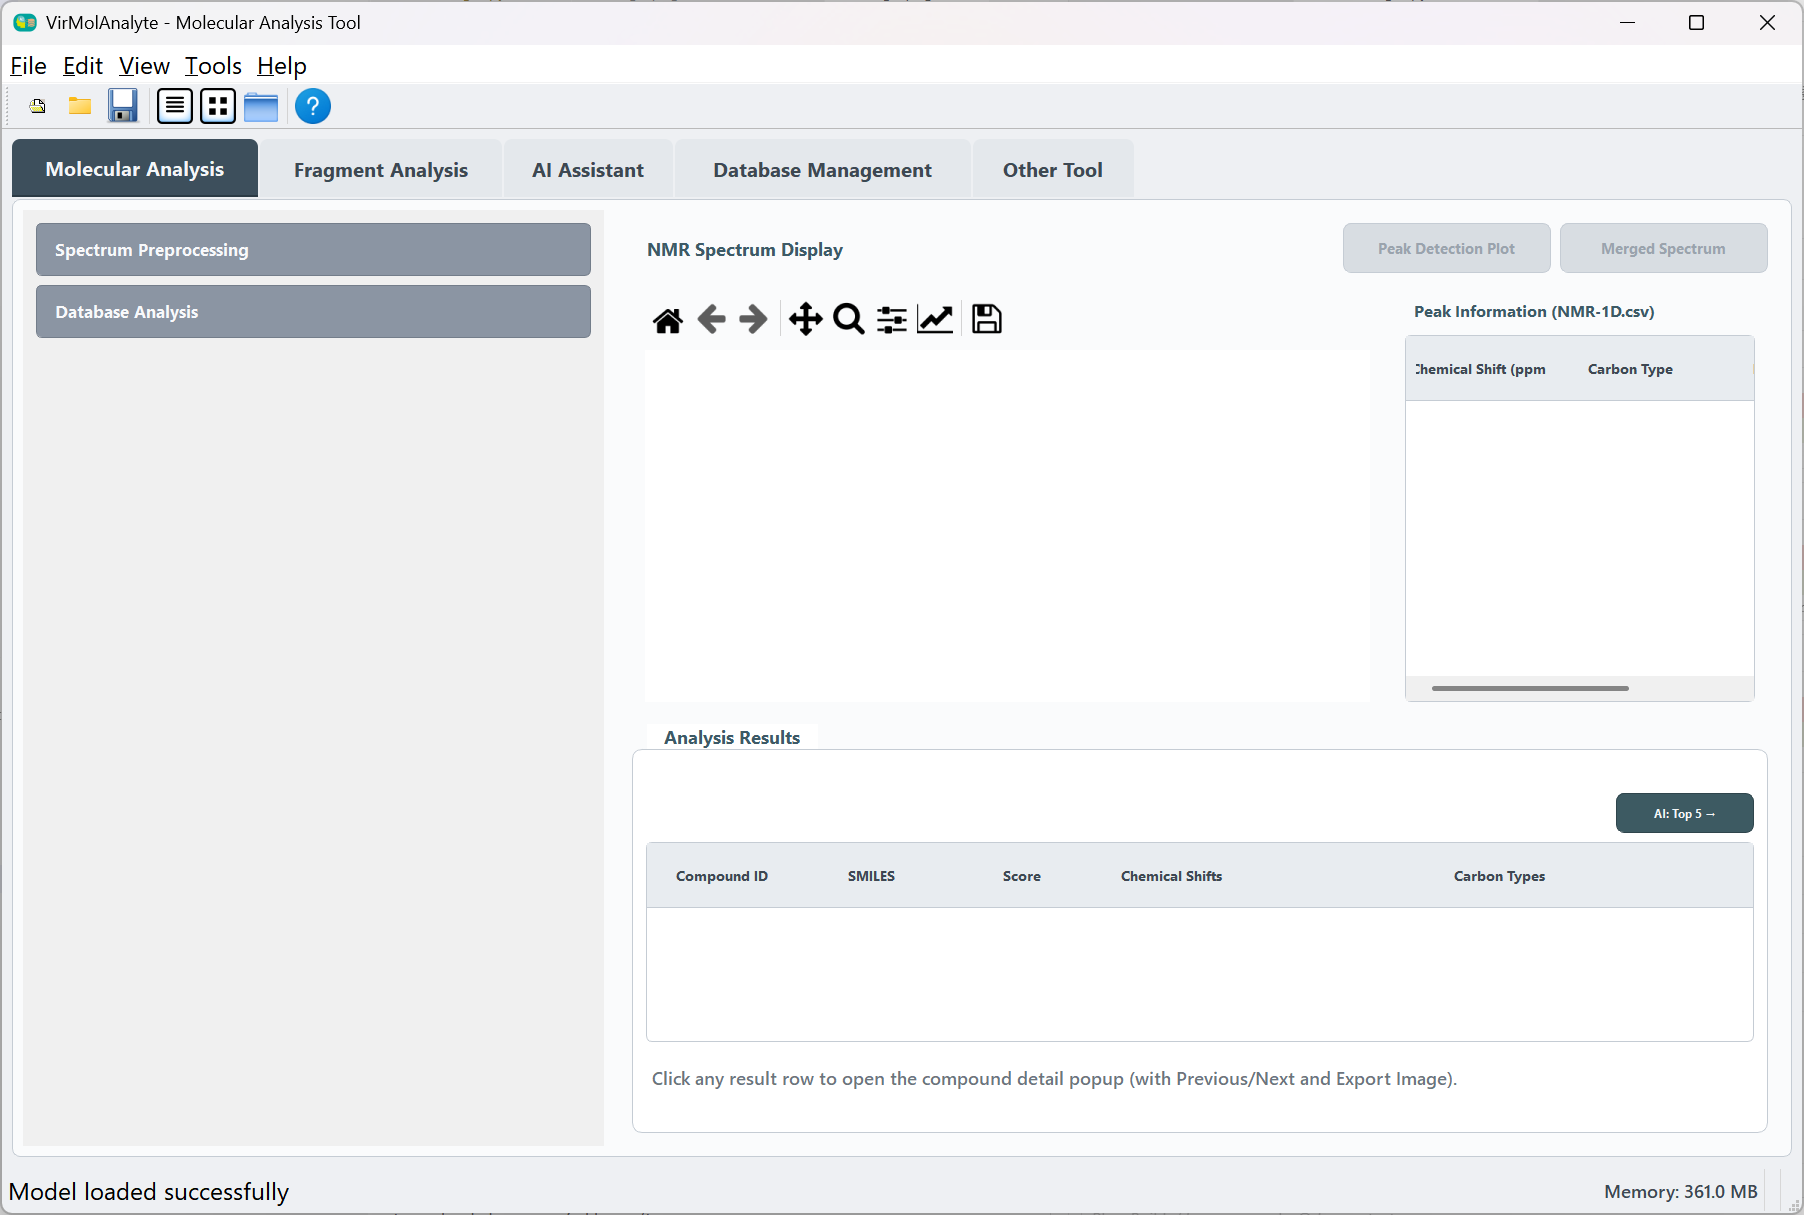 Left panel
- Collapsible Spectrum Preprocessing (collapsed by default): spectral paths, peak thresholds, solvent/impurity removal.
- Collapsible Database Analysis: manual peaks, database selection, filters, evaluator, Start Analysis / Copy methods text / AI: Top 5 →.
- Progress bar (visible during database analysis).
Right panel
- NMR Spectrum Display: Matplotlib canvas + toolbar; toggle Peak Detection Plot / Merged Spectrum.
- Peak Information (NMR-1D.csv): chemical shift, carbon type, intensity.
- Analysis Results: five-column table; click row for details; context menu for AI actions.
Workflow
① Set spectral data folders (or skip with manual peaks)
- Expand Spectrum Preprocessing → Spectral Data Input.
- Set three Bruker processed data directories (typically
...\pdata\1):
| Field | Description | Example (demo) |
|---|---|---|
| 13C_NMR | Broadband ¹³C spectrum | test\NMRsample\4\pdata\1 |
| DEPT90 | DEPT-90 | test\NMRsample\8\pdata\1 |
| DEPT135 | DEPT-135 (positive/negative) | test\NMRsample\6\pdata\1 |
- Use the folder icon to browse. Data are read with nmrglue (
ng.bruker.read_pdata).
Skip this step
If you already have a peak list, fill Manual peak input under Database Analysis (step ④) and go directly to ⑥ after loading the database.
② Run peak detection and merge
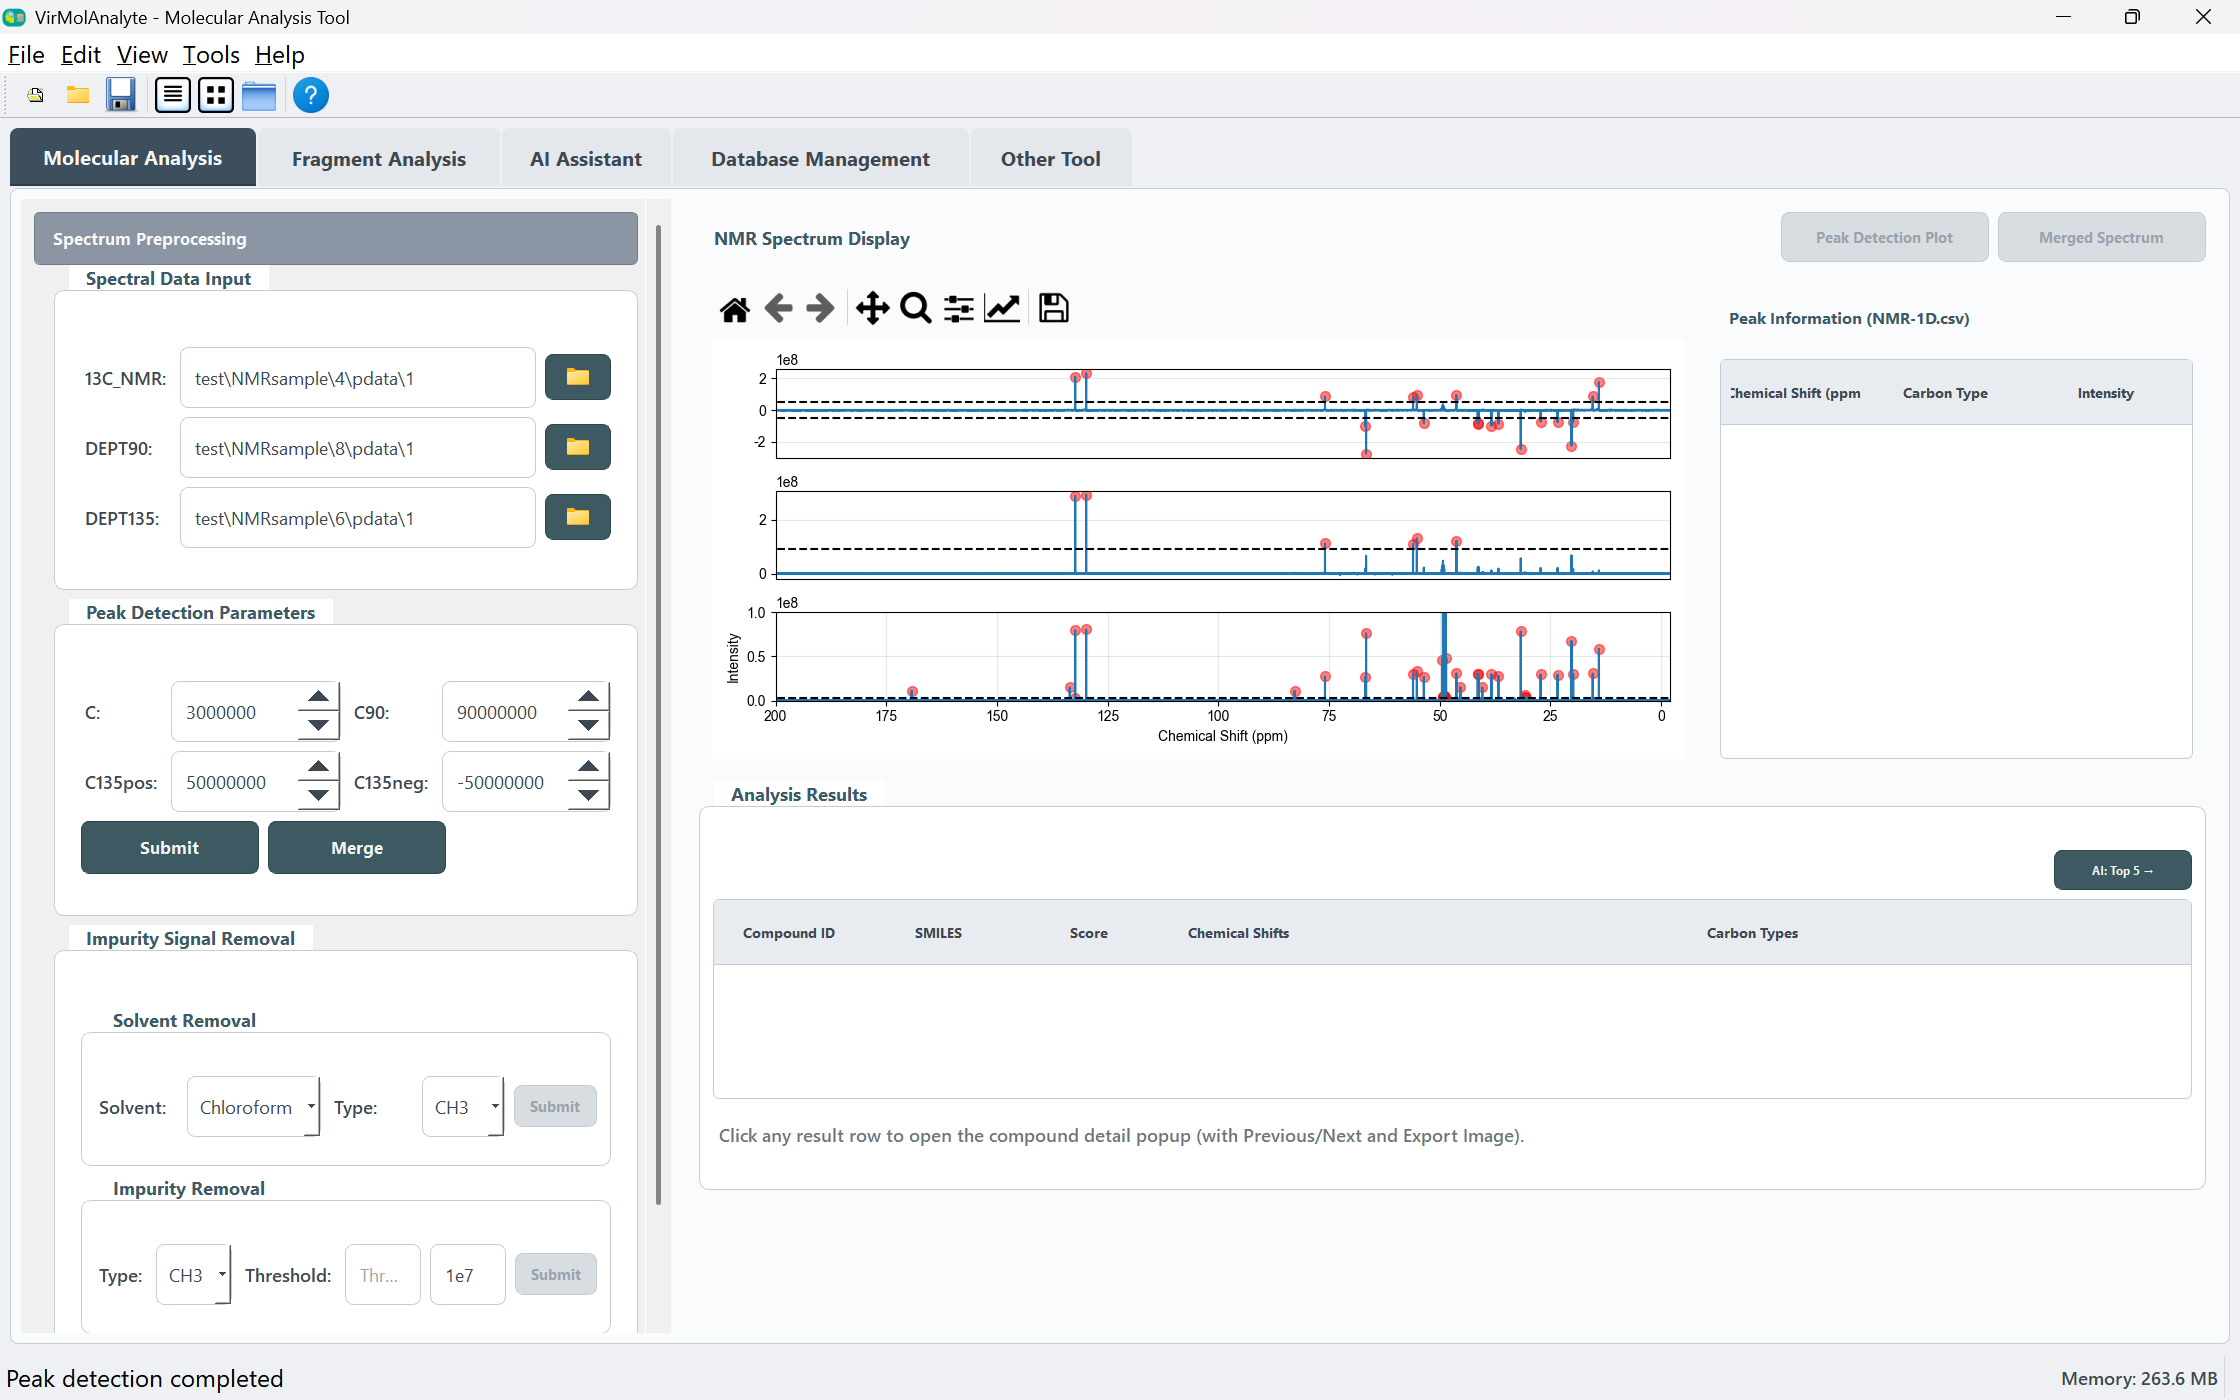
- Expand Peak Detection Parameters.
| Parameter | Default | Description |
|---|---|---|
| C | 3000000 | ¹³C peak-picking threshold (instrument-dependent) |
| C90 | 90000000 | DEPT90 threshold |
| C135pos | 50000000 | DEPT135 positive threshold |
| C135neg | -50000000 | DEPT135 negative threshold |
- Click Submit. On success: right panel shows peak-detection view;
- Click Merge. The tool sorts carbon types, reconstructs the combined spectrum, and writes
GUI_result_files/NMR-1D.csv.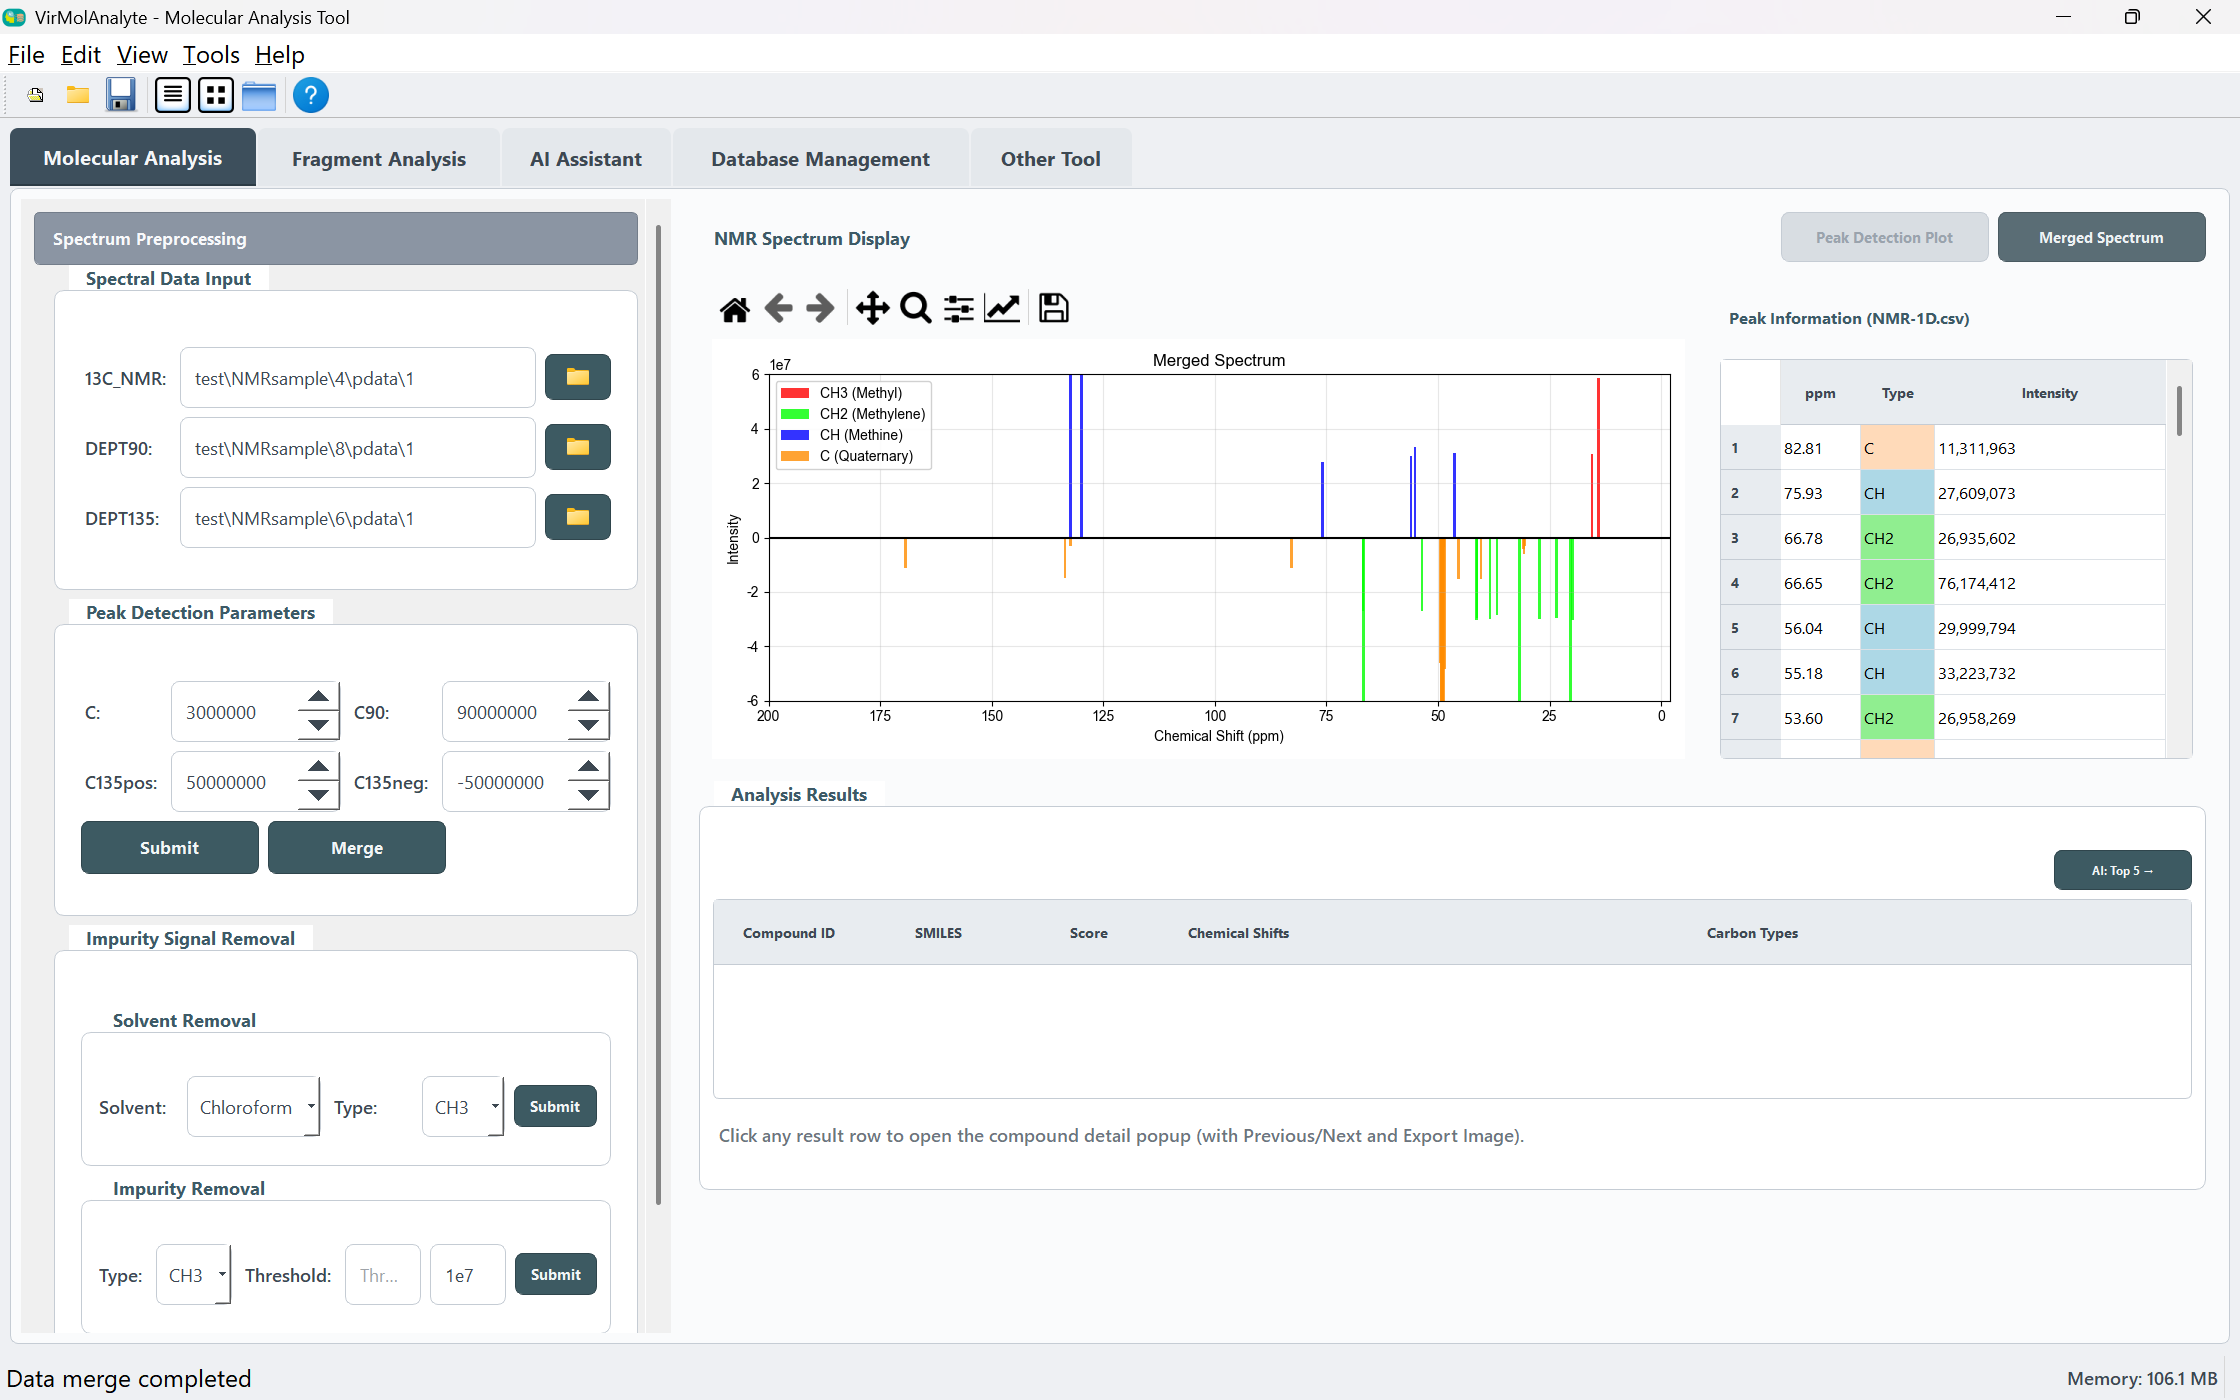
③ Optional: Solvent and impurity removal
Solvent Removal (after Merge)
| Control | Options |
|---|---|
| Solvent | Chloroform, Methanol, DMSO, Pyridine |
| Type | CH3, CH2, CH, C |
| Submit | Removes solvent peaks for the selected carbon class |
Impurity Removal
| Control | Description |
|---|---|
| Type | CH3, CH2, CH, C |
| Threshold | Two factors; effective threshold = Threshold1 × Threshold2 (default second box 1e7) |
| Submit | Requires Threshold1; uses absolute method |
Each step updates NMR-1D.csv and the merged spectrum view.
④ Load database and set filters / evaluator
Database Selection
| Dropdown | Internal file | Size (UI label) |
|---|---|---|
| Plant Database | Database/Plant.npz |
188,478 NPs |
| Human Database | Database/Human.npz |
217,347 NPs |
| Microbial Database | Database/Microorganism.npz |
36,427 NPs |
| Drug Database | Database/Drug.npz |
— |
| All Database | Database/AllDB.npz |
605,735 NPs |
- Load Database or browse Other Database (
.npz) → Load Other Database. - When loaded, Start Analysis is enabled.
Filter Parameters
| Filter | Parameter | Default | Description |
|---|---|---|---|
| CNF ✓ | CNF bias | 5 | Carbon-count filter tolerance |
| CTNF ✓ | CTNF bias | 2 | Carbon-type count filter (q/t/d/s) |
| MW | MW list | 300,400 |
Molecular weight filter when checked |
Evaluator Parameters (choose one)
| Evaluator | Extra parameter | Default | Description |
|---|---|---|---|
| CSS | CSS threshold | 0.5 | Chemical-shift similarity style score |
| AAS | — | — | Average absolute deviation style |
| FPS | — | — | Fingerprint similarity |
| FPAACS ✓ | FPAACS weights | 0.2,0.3,0.5 |
Weighted combination (default) |
⑤ Start analysis and review results
- Click Start Analysis. Progress runs in
AnalysisThread; results saved toGUI_result_files/Result.csv. - Analysis Results columns: Compound ID, SMILES, Score, Chemical Shifts, Carbon Types.
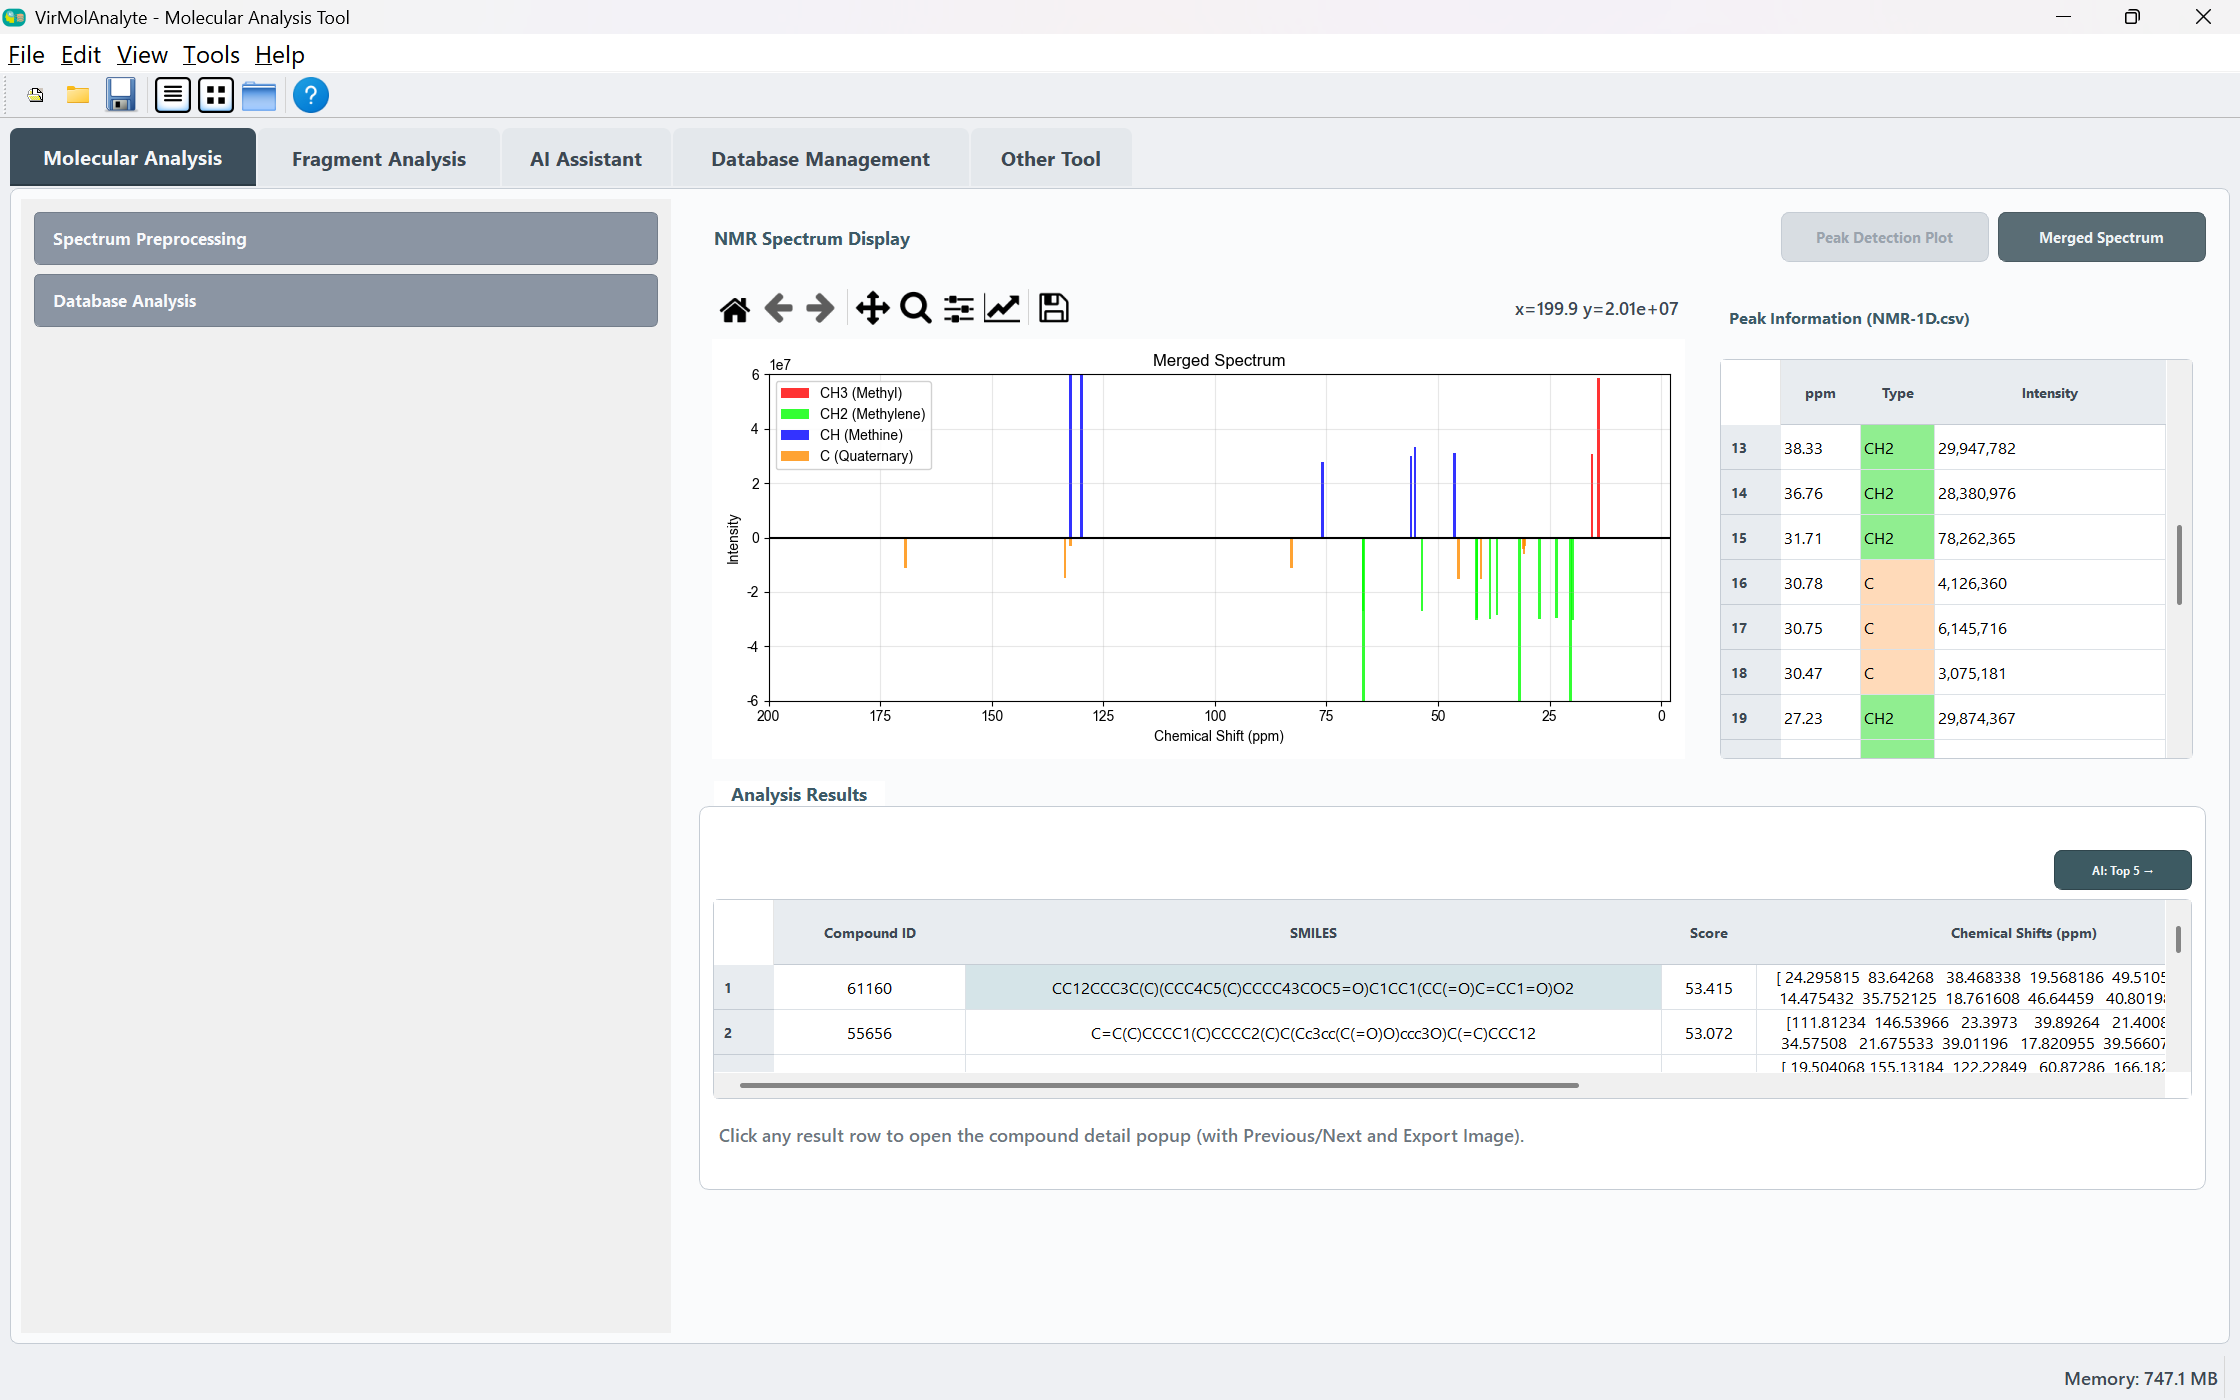
- Click a row → Compound Details: SMILES copy, Previous/Next, spectrum canvas
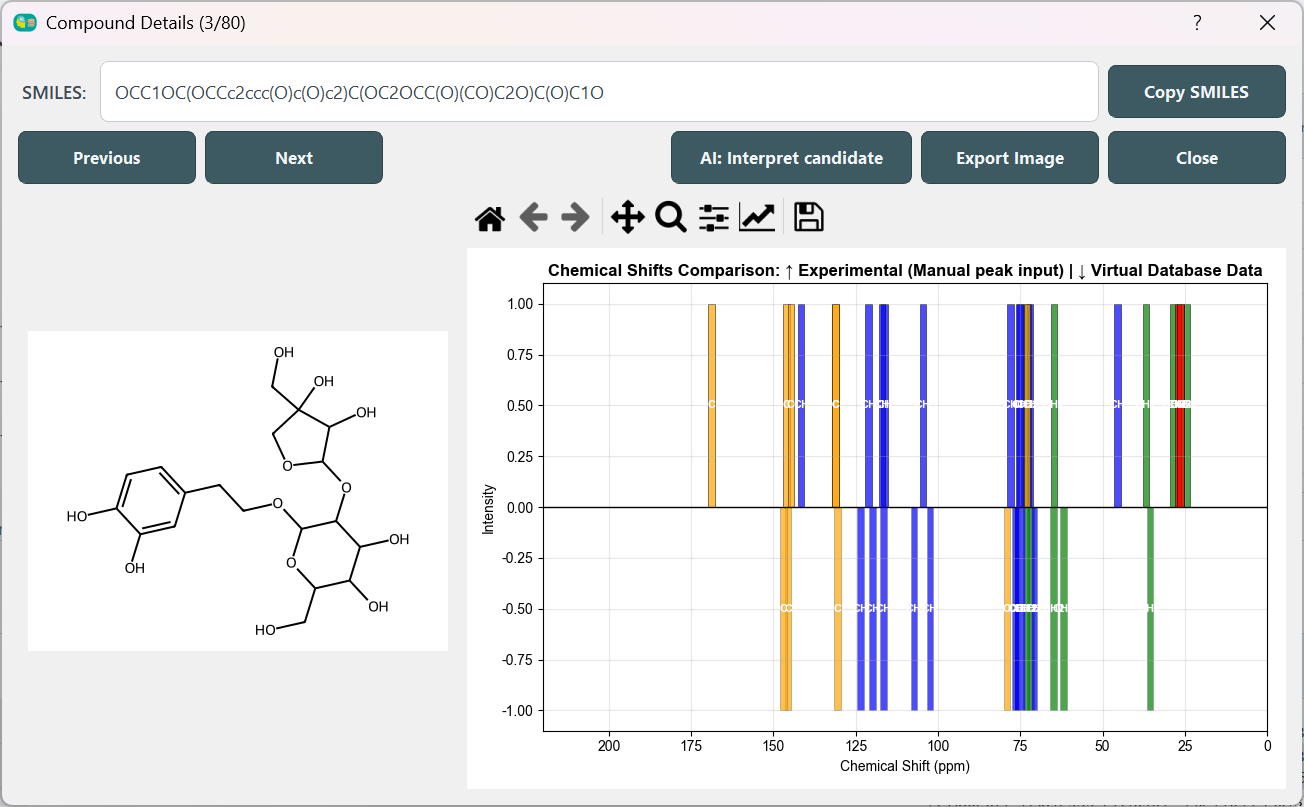
- Optional: Copy methods text, AI: Top 5 → (switches to AI Assistant tab).
⑥ Output file structure
Under GUI_result_files/:
GUI_result_files/
  NMR-1D.csv      # After Merge / solvent / impurity (ppm, type, intensity)
  Result.csv      # After Start Analysis (Top-N hits)
Legacy: if NMR-1D.csv exists only in the app root, it is used when the folder above has no file.
FAQ
-
"Please select all required data folders" on Submit Set all three spectral paths before peak detection.
-
No peaks / peak detection failed Lower C, C90, or C135 thresholds; confirm paths are valid Bruker
pdataand nmrglue is installed. -
Start Analysis: no peak data Run Merge or fill Manual peak input with valid
ppm, typelines. -
Failed to load database Ensure
Database/Plant.npz(etc.) exists relative to the application root. Custom libraries must match the format from Database Management. -
"No compounds meet the search criteria" Widen CNF/CTNF/MW filters; check that experimental peak count and q/t/d/s pattern are compatible with the library.
-
Merge opens extra Matplotlib windows The GUI forces Qt5Agg and
DrawWin="False"; if pop-ups appear, close other scripts using interactive pyplot. -
Open / Save Project does nothing useful
.vmpproject files are placeholders; rely onResult.csv, exports, and screenshots.
Relation to Other Modules
- Fragment Analysis: Requires
Result.csv/ non-empty result table and experimental peaks from this tab (file or manual input). Run masking attribution is enabled after successful analysis. - AI Assistant: Uses screening results, peaks, and optional fragment context for Top-N and diagnosis; Copy methods text is shared with this tab.
- Database Management: Produces custom
.npzfiles loaded here via Load Other Database. - Other Tool: Independent SMILES drawer; no link to screening results.